
(image from https://towardsdatascience.com/why-data-analytics-is-gaining-hype-in-the-21st-century-b7b1ca289f09)
Tatari has always been a strong data and analytics company, and recently we have been looking for ways in Engineering to use our internal data to improve our engineering processes. We decided to introduce our own Data Analytics tool for use by engineers and managers, and naturally we looked first for a good open source tool. Our goals were to support ad-hoc query sharing and simple analytics dashboard creation. We evaluated a number of the leading open source tools, and we wanted to share the results of that evaluation.
Classically the use of business intelligence (BI) tools has been the providence of sales, marketing and executive teams. BI tools allow analytically sophisticated users to extract useful trends and insights from the mountains of data generated by modern online businesses. Typically these tools are sponsored and maintained by a dedicated “Data Analytics” team. Charts and analyses are created by a small number of specialists in the company, but these insights will be shared out to a much larger group of users.
The BI market has been around for a long time and has spawned multiple generations of tools - starting with on-premise solutions and later evolving into cloud-based SaaS offerings. Current market leaders like Tableau and Looker offer huge feature sets and the ability to perform analysis against a wide variety of data sources. As developers who are fans of open source, we decided to evaluate the open source options first.
Open Source Alternatives
Alongside commercial offerings there is now a large field of open source offerings. Most of these tools offer a roughly comparable core feature set:
- “Pluggable” support for querying data from a wide variety of data sources
- Ad-hoc SQL query builder
- Ability to easily share saved queries with your team
- Creation of various charts, graphs, and other visualizations of query results
How we plan to use the tool
There was some discussion in our team about our motivations for introducing a BI tool into engineering. Whereas many business cases of BI tools are centered around measuring and optimizing key performance metrics for the company, engineering brings a slightly different focus:
- Quickly answer specific data questions (”How many user logins failed this week?”)
- Simple exploration of data and relationships (”Get a list of users with invalid looking email addresses”)
- Ad-hoc charting of some key metrics impacting engineering (”growth of our AWS spend”, “count of PRs merged per week”).
Notably, we didn’t know the questions we want to ask in advance. We have a long term goal to measure our work and use data to drive better engineering decisions. But we aren’t sure which things we should be measuring and looking to optimize. Like any exercise in agile development, we expect to start small and iterate over time.
In the end, the simplicity of use for the tool became our key criteria. We want to see widespread use of the analytics tool in engineering, but analysis won’t be anyone’s full-time job, so easy of adoption and use is super critical.
Following are some of the tools we evaluated.
Apache Superset
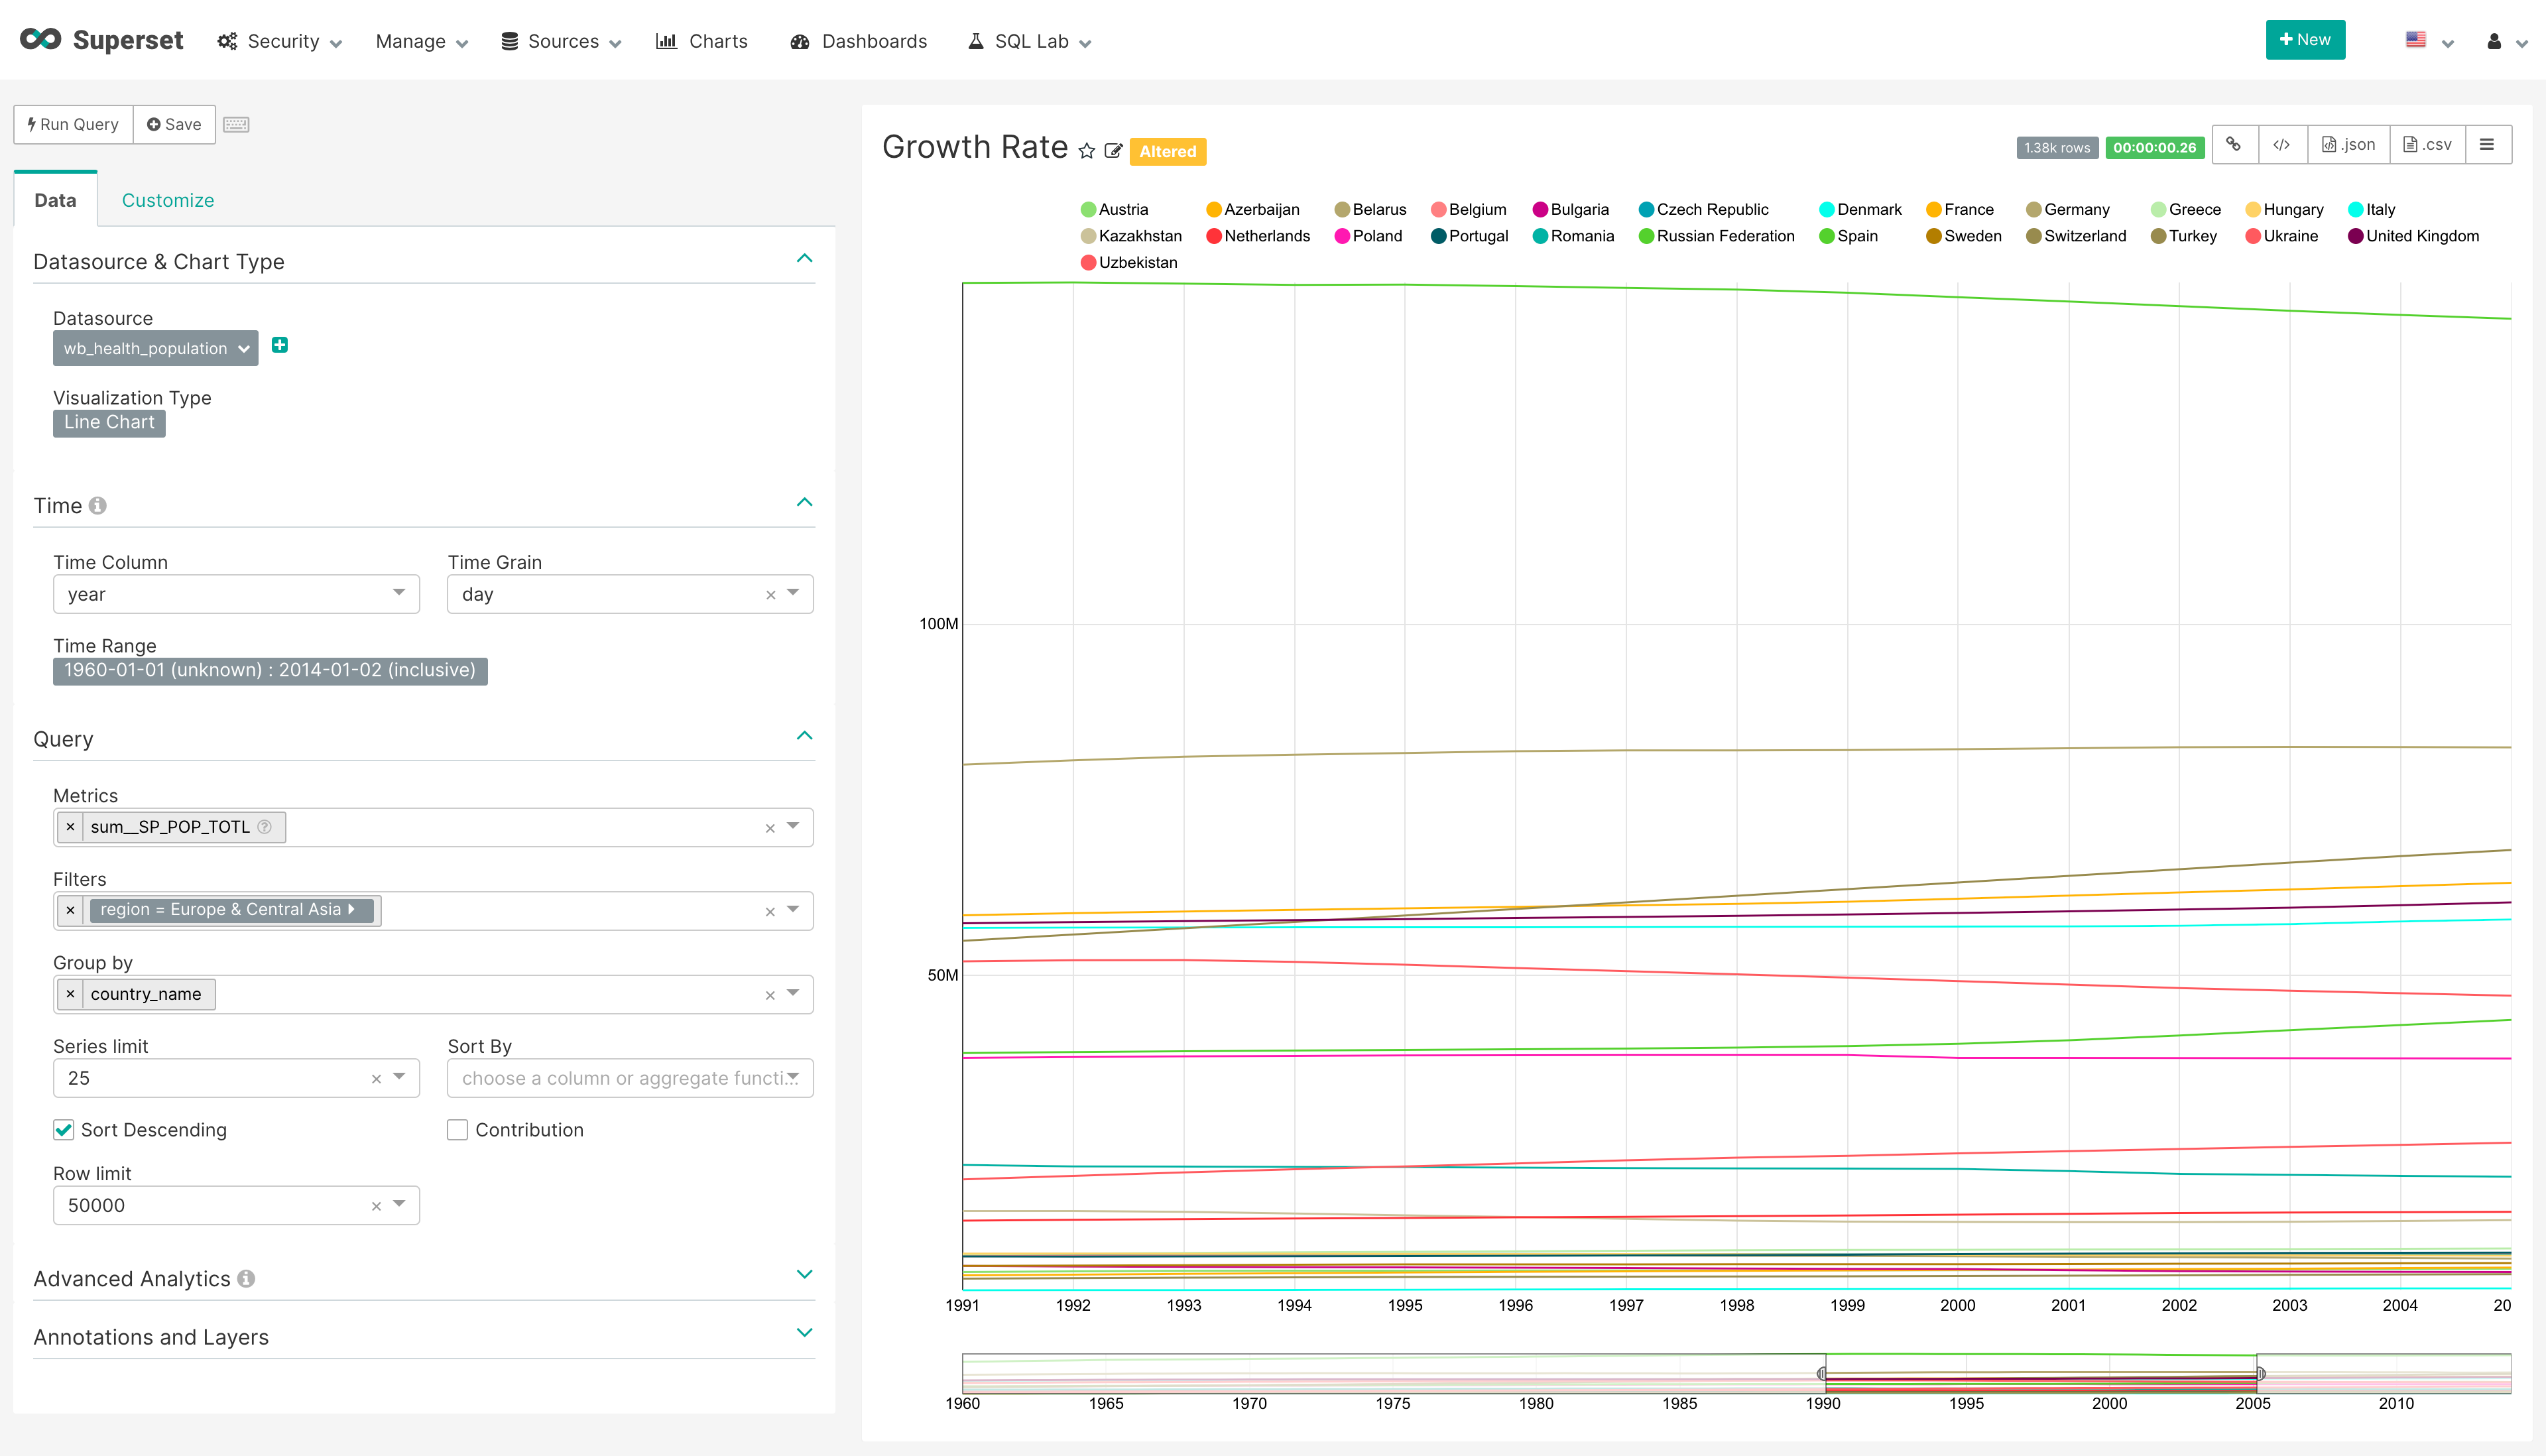
Supset was originally created at Airbnb by Maxime Beauchemin, the creator of Airflow. We are big fans so it made sense to consider Superset. And indeed, Superset has some pretty powerful features. It spikes heavily on its open architecture for building custom visualizations. However, getting Superset installed, integrated into our data sources (Postgres, Redshift, and S3), and setup with some reasonable authentication turned out to be a non-trivial task.
Superset has a design where ad-hoc SQL querying appears in a separate view from the “BI tool” query and visualization builder. This split seemed unnatural, and in fact the query builder which supports charting doesn’t support joining across tables. Given that we want to analyze our data mostly “in situ” without spending a lot of time denormalizing this proved a big limitation.
Redash.io
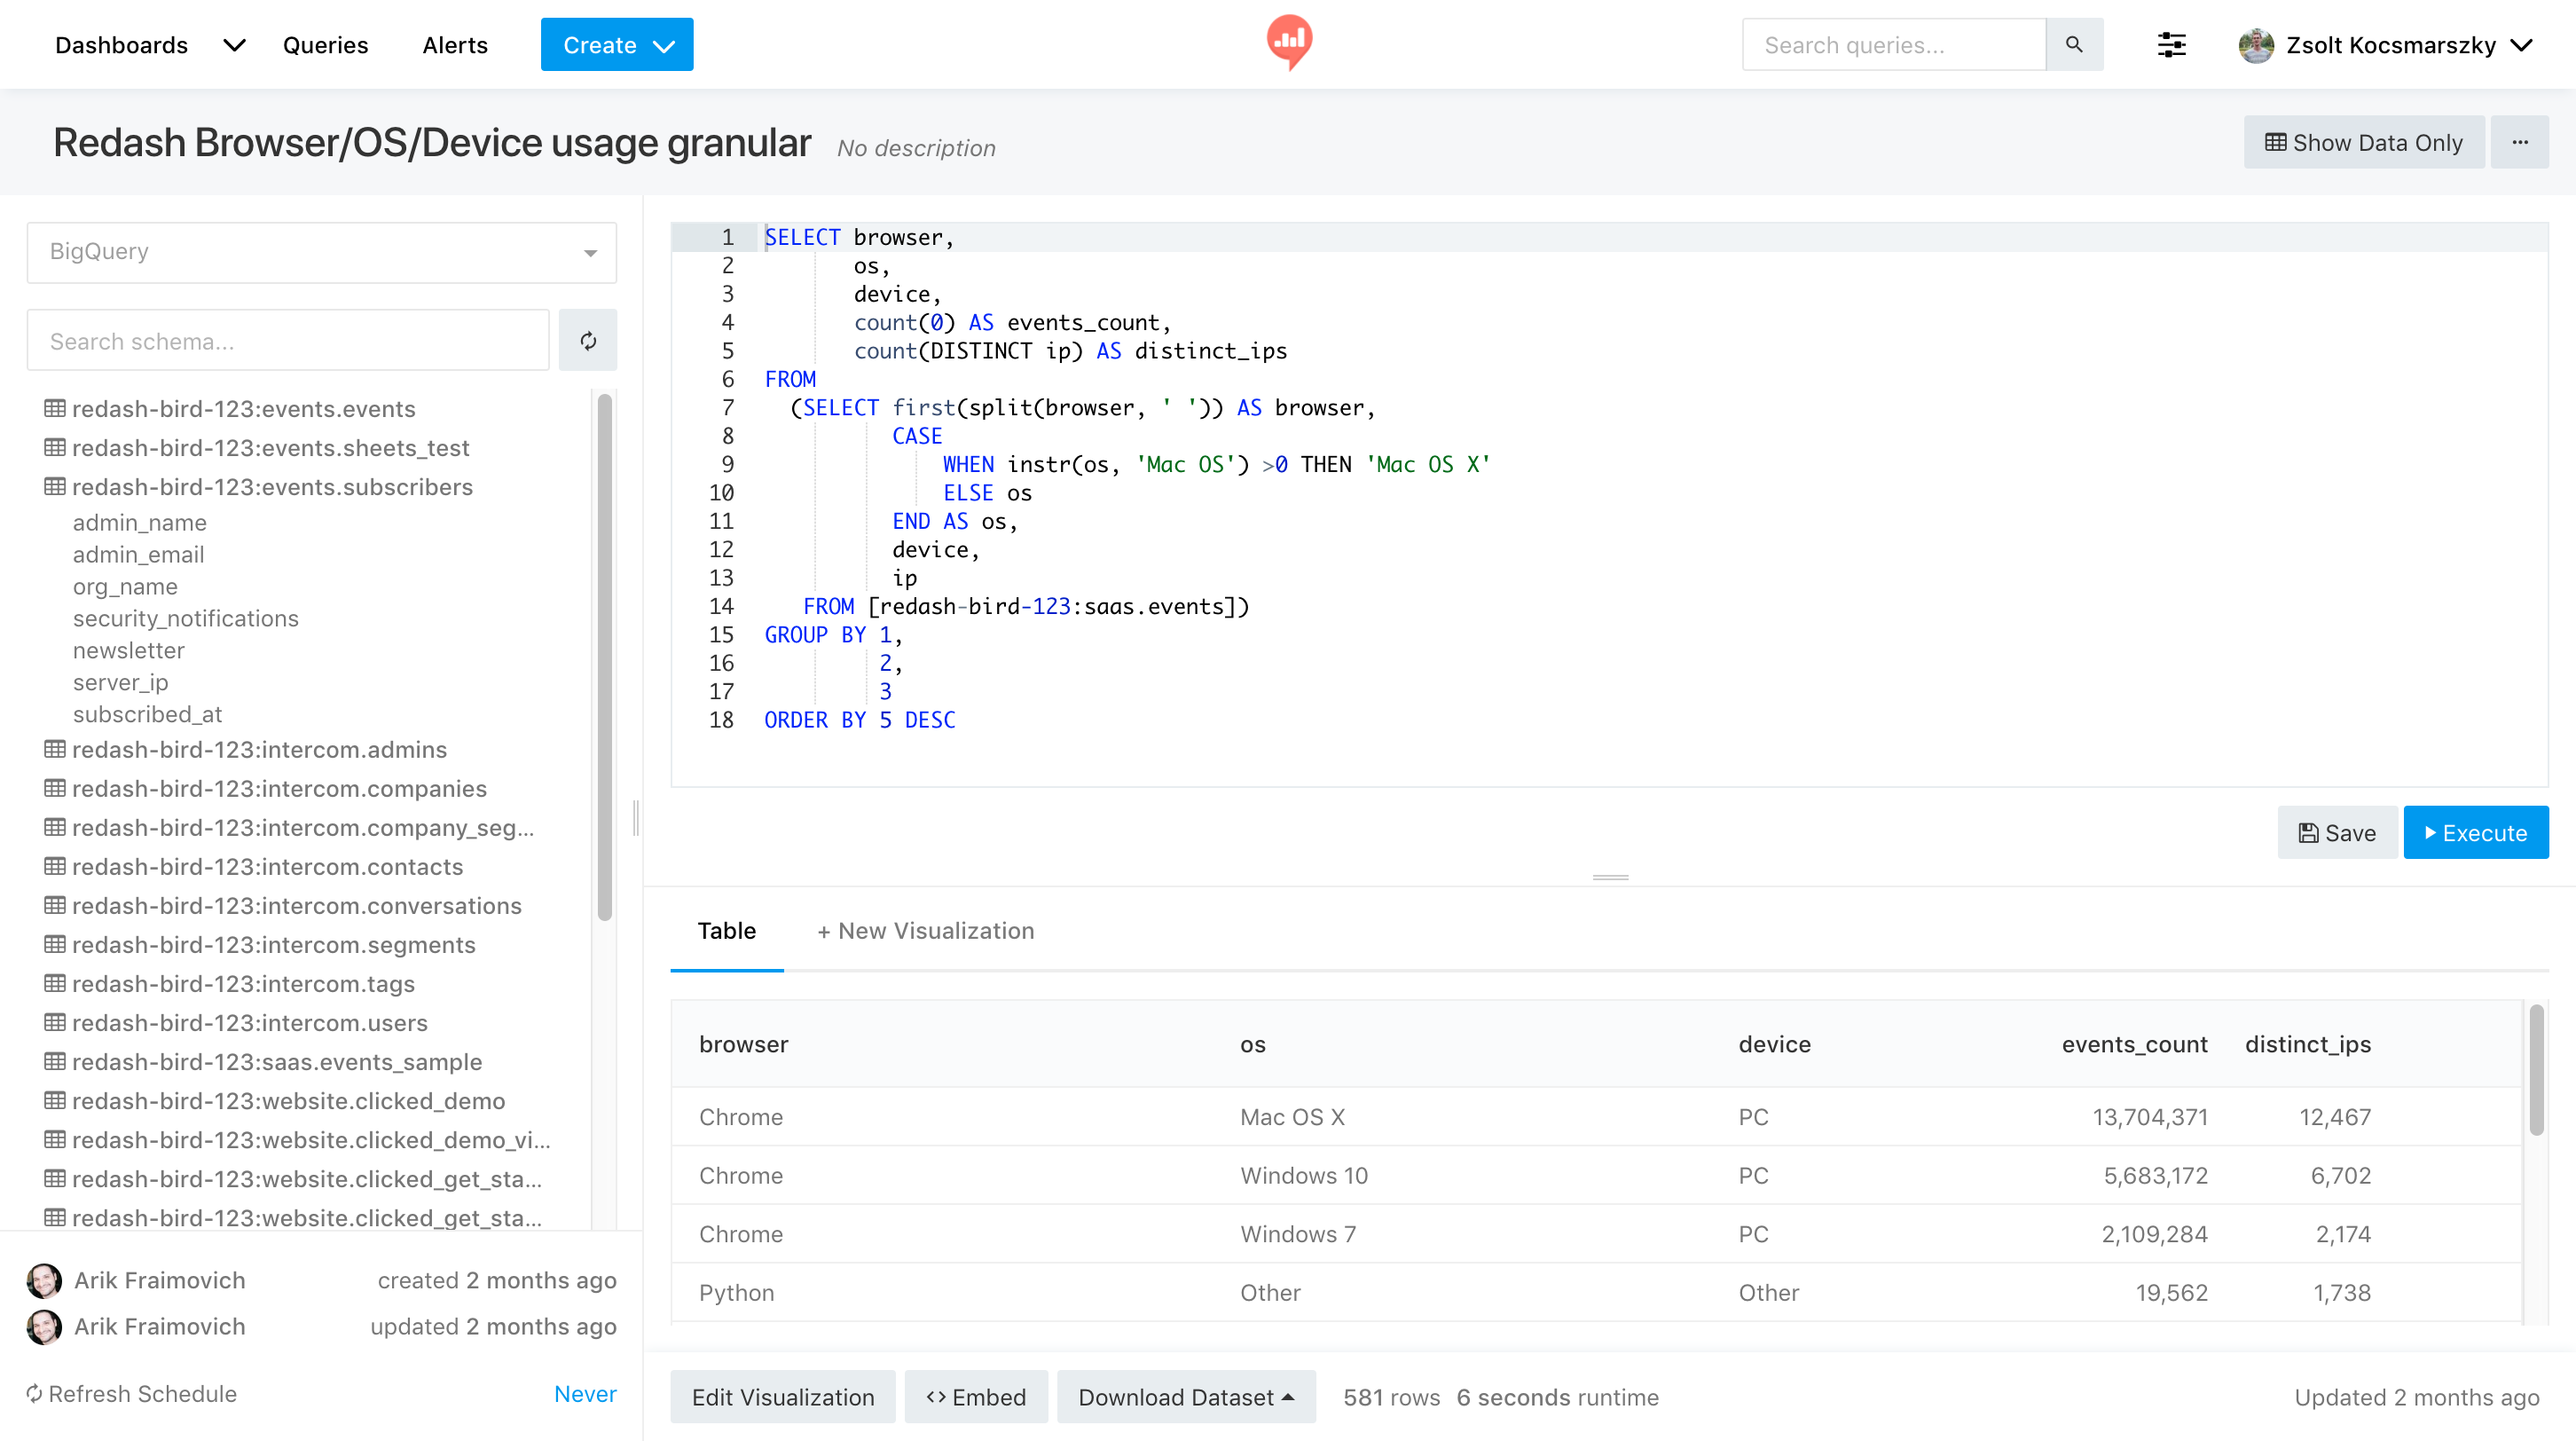
The next tool we looked at was Redash. Redash exists as an open source project, but the project was acquired by Databricks and they now offer a hosted version as a commercial product. Redash is a very good tool, including support for table joins that Superset does not. However, we found the documentation to be just adequate. Redash also requires a Postgres instance and a Celery broker to run it self-hosted. These aren’t huge requirements, but they definitely implied more operational burden to run the tool ourselves.
Metabase
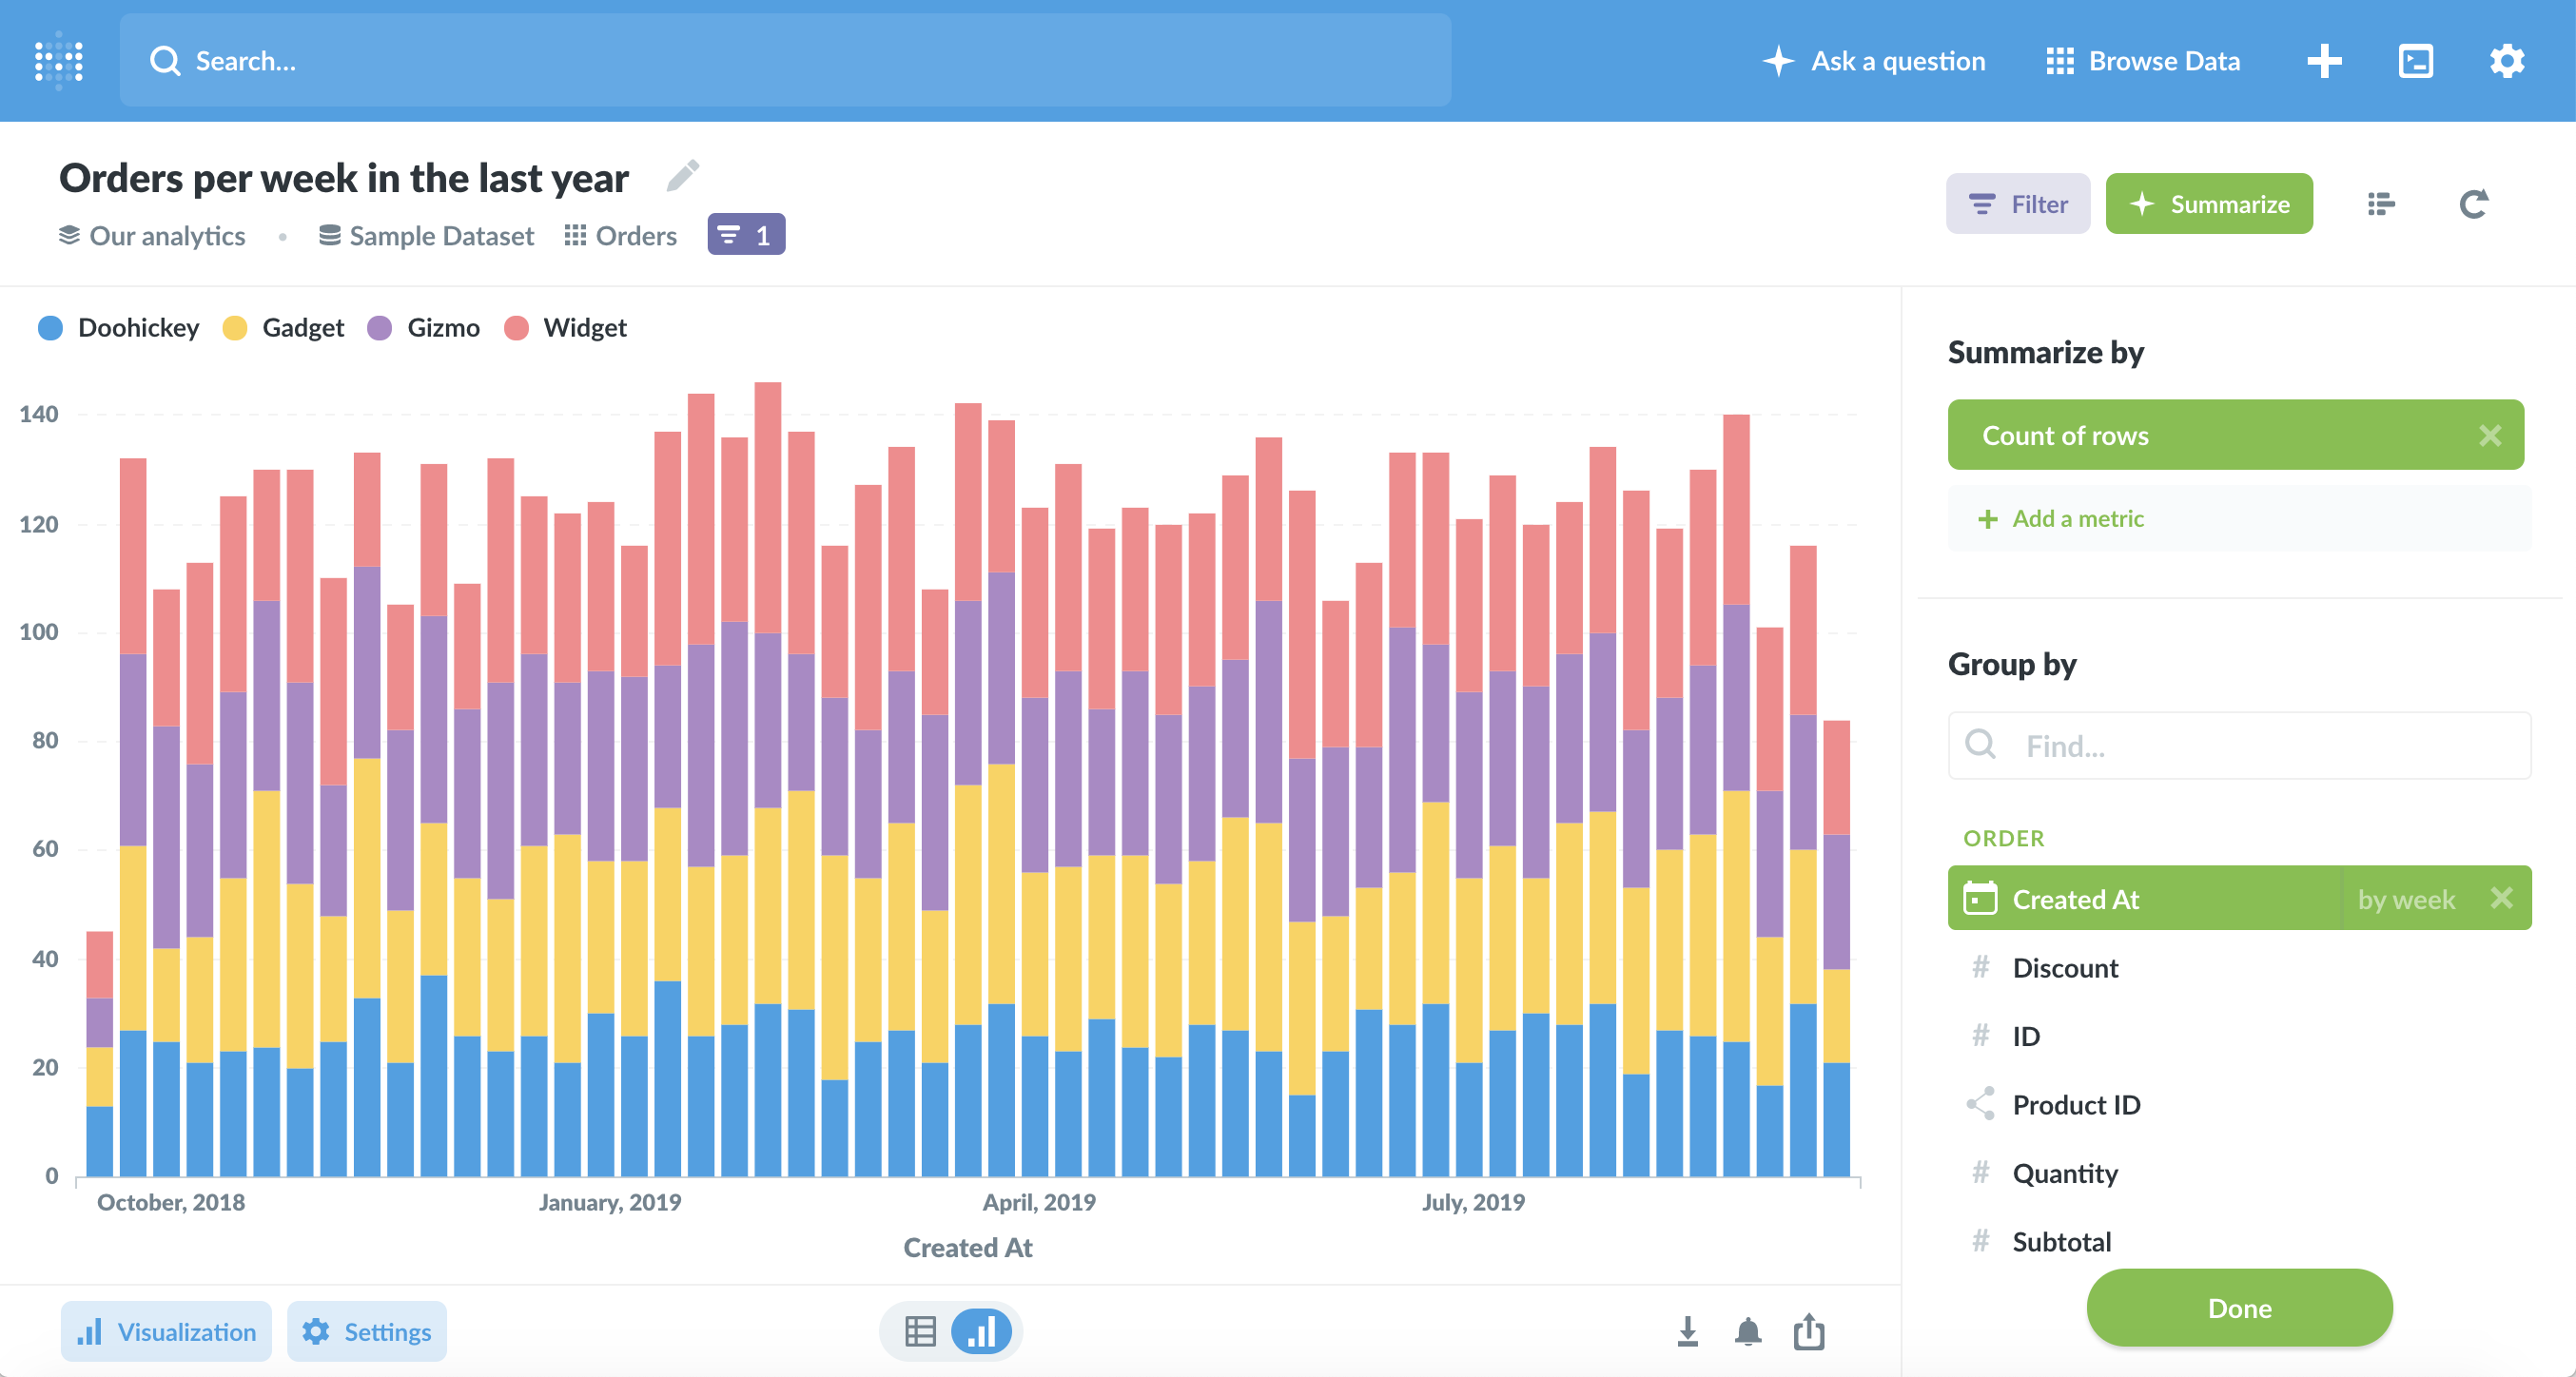
Some of the team had used Metabase in the past and recommended it, so we included it in our evaluation. One of our favorite things about Metabase turned out to be its dead-simple installation process. The whole server can run on a single box, and we ended up simply using their Deploy to Heroku button to get the server running.
Setup and administration of the Metabase also turned out be incredibly smooth. Setting up users, groups, and permissions was straightforward, as was configuring new data sources.
Note that Metabase (and all these tools) differs from many commercial offerings in that it doesn’t rely on a “data cube” design, where data is ingested and cached in the tool for analysis. Instead Metabase queries always run live against the original data source. This is OK for our use case because our primary source is our Redshift data warehouse which is reasonably optimized for OLAP usage. Nonetheless, it pays to worry about your Workload Management configuration to isolate any run-away queries that might get issued by Metabase users.
Metabase is very much oriented towards ad-hoc data exploration and quick analysis. It’s X-Ray feature gives you a quick “glimpse” at the contents of a table without writing a single character of SQL. After clicking around your data, you can build a real query in raw SQL, or with the point-and-click query builder, and then easily put a visualization on top of your results. Only after we got it running did someone find this podcast interview with the head of the Metabase project where he articulates a strong emphasis on this kind of usage.
We are already starting to build and share basic dashboards for use in engineering, including charts of customer growth, data ingestion volume, and AWS costs. We are excited to see lightweight reporting and charting become a normalized part of our product engineering practices here at Tatari.