
As a startup’s needs grow past the initial creation phase, the number of third-party services can grow just as fast, or faster. Tracking and managing those costs, without having to pay yet another bill for someone else to do it, is extremely important for keeping total cost of infrastructure under control. Tatari recently built a system to aggregate and correlate infrastructure costs from multiple third-party services into one platform. This allows us to easily visualize cost changes and distribution.
Why create a new cost analysis tool?
For years Tatari relied on each individual services’s cost analysis tools to report what we were using and how much it cost. This is an acceptable strategy when you rely on a few isolated services. But what happens when you start to use five, 10, heck even 20 cloud-based SaaS products that all start to interact with each other in new and different ways? Each service still reported its own usage and costs, but we couldn’t correlate costs between services or see dependency chains. To overcome this problem we decided to build a new tool which consumes cost and usage data from many services, houses that data in a separate datastore, and can visualize the mixed data to provide a full picture of Tatari’s infrastructure costs.
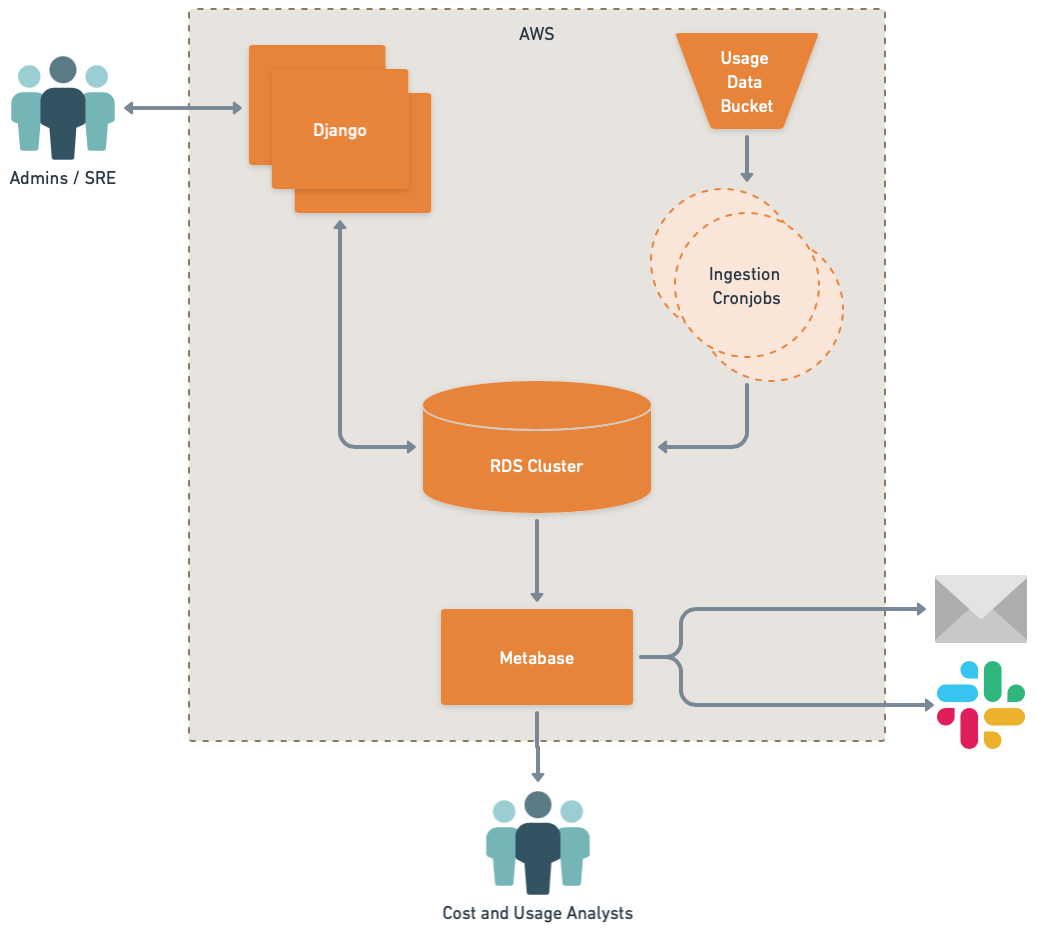
At the head of our new tool is the Python web framework Django. It is a batteries-included, feature-rich framework that allowed us to create the basis of our tool very quickly. This includes an admin web interface for editing data, a database Object Relational Mapper (ORM) (for more information on ORMs, see this Tatari blog post by Alex Fraczak-Benitez), and an easy-to-comprehend custom command structure.
In order to visualize the newly aggregated data we chose to use Metabase which has an intuitive interface, but still offers powerful custom queries to compare disparate data.
Get that data
The first, and arguably most difficult, part of creating our new tool was figuring out what data we needed from the upstream services and how to obtain it. In the case of AWS cost and usage data, that can take some serious planning. Once we determined which pieces of data were needed Django’s ORM made it very easy to create models for representing that data in PostgreSQL tables.
class AWSRegion(Model):
    region: CharField = CharField(max_length=20)

    class Meta:
        db_table: str = 'aws_regions'

    def __str__(self) -> str:
        return f'{self.region}'


class AWSService(Model):
    name: CharField = CharField(max_length=60, unique=True)

    class Meta:
        db_table: str = 'aws_services'

    def __str__(self) -> str:
        return f'{self.name}'


class AWSProduct(Model):
    product: CharField = CharField(max_length=60)
    usage_type: CharField = CharField(max_length=60)
    operation: CharField = CharField(max_length=60)
    service: ForeignKey = ForeignKey(AWSService, on_delete=CASCADE)

    class Meta:
        db_table: str = 'aws_products'
        unique_together: list[list[str]] = [['product', 'usage_type', 'operation']]

    def __str__(self) -> str:
        return f'{self.product}.{self.usage_type}.{self.operation}'
Since we now have our raw, or “Bronze” data in the medallion data tiering nomenclature, we set out to aggregate and enrich this data into a “Silver” layer. Most of this processing consists of:
- adding missing tags to data items in the Bronze layer (e.g. code environment names)
- distributing periodic costs over time (amortization)
- dynamically calculating attribution costs based on other Bronze data
Amortization is an important feature because it allows us to display even better data than some service’s cost reports can.
Finally, to continue to ingest new data and continually perform enrichment tasks, we chose to create daily cronjobs for simple scheduling. These jobs call custom Django commands which execute ingestion and enrichment logic.
Graphs or it didn’t happen
Metabase is a good beginner to intermediate data visualization tool that offers out of the box dash-boarding, graphing, and even email and Slack alerts. We were already utilizing it for some other database queries so it was an easy fit to add our new tool’s database to it.
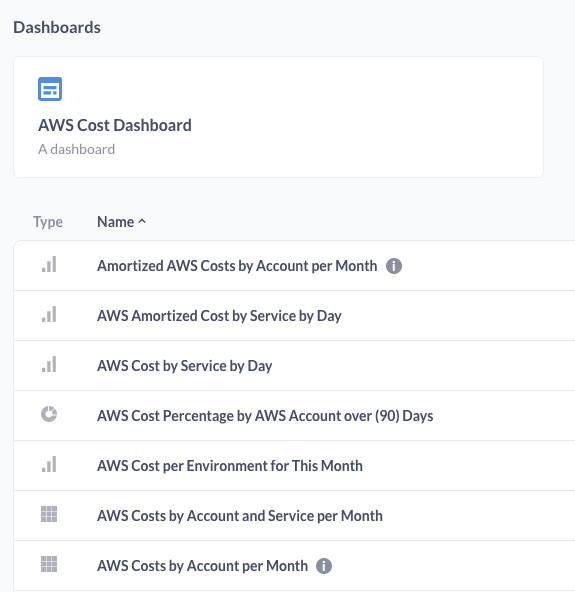
Because Metabase can be authenticated to with our org’s SSO system we can allow anyone with proper permissions see all the data and create new visualizations. This prevents a single analysis team from being the bottleneck for better analyses or dashboards.
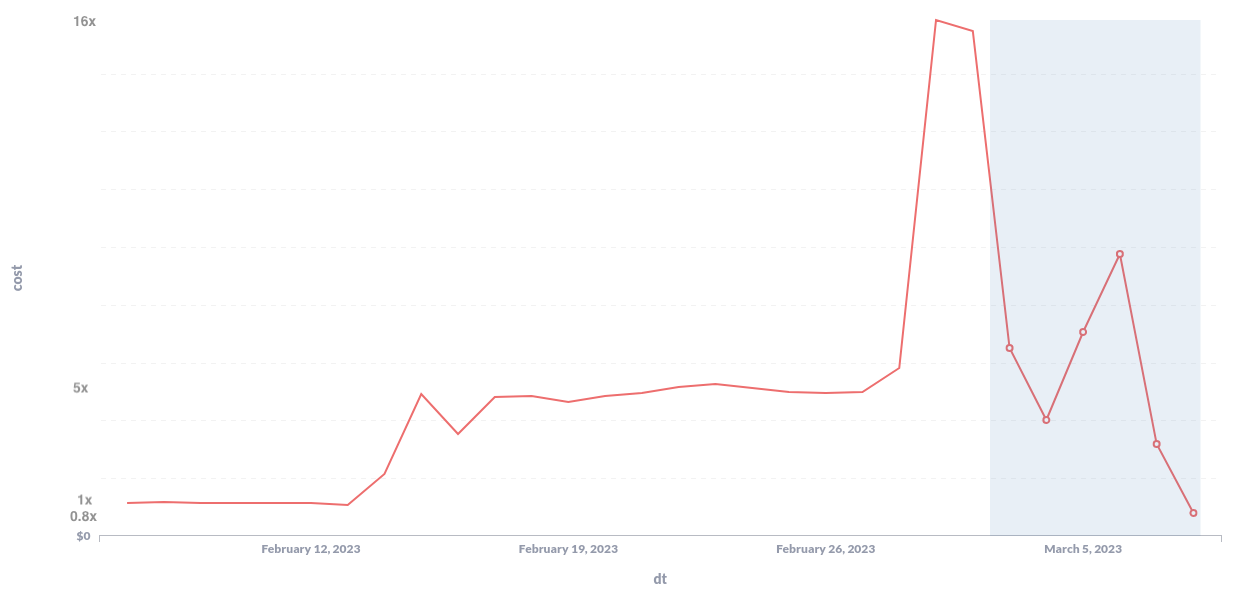
We’ve already uncovered some surprising cost centers in our data, and used these visualizations to adjust infrastructure to save money. For example some of our ETL jobs were incurring unneeded costs by unnecessarily reordering data. Once we uncovered that and found the root cause we were able to reduce costs of that job to levels lower than before.
Better than TPS reports
Compared to more advanced business intelligence tools like Tableau or Superset, Metabase is relatively simplistic. However for most of our use cases it handles reporting and visualization tasks well.
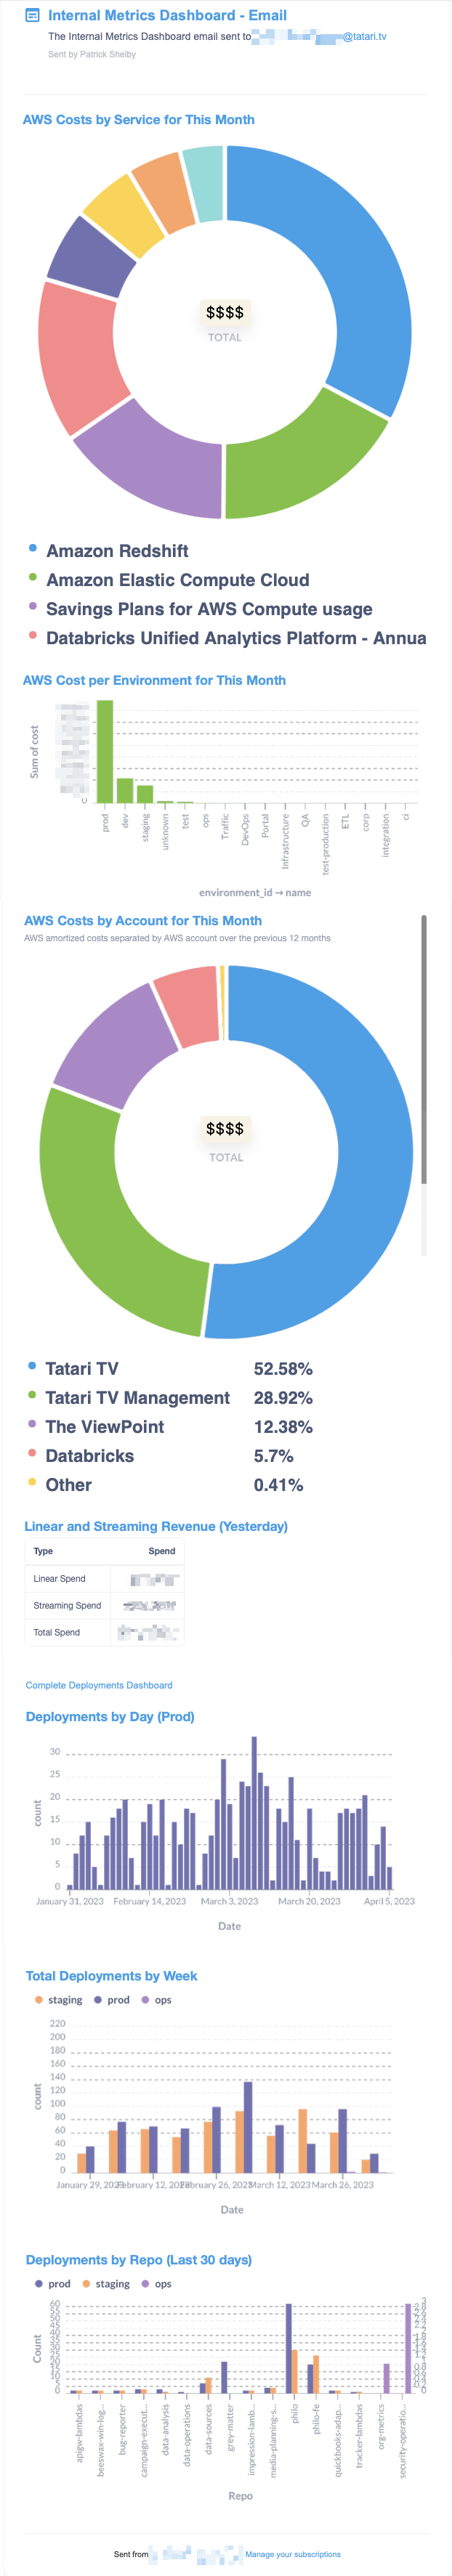 Sensitive data has been blurred, it’s not your eyesight
Currently when Metabase sends dashboards via email or Slack it manipulates the included graphs in strange ways causing them to look different or even unreadable. To work around this we were able to simplify our dashboards specifically for emails and choose graph types that weren’t as adversely affected.
Conclusion
Spending one quarter building a new cost analysis tool was an intense undertaking. However this tool is already saving tens of thousands of dollars annually through the advanced reports it provides. We’ll be continuing to improve the tool in the coming quarters with more advanced features like prediction, additional enrichment, and extra modularilty to support even more upstream services.
Huge thanks to Calvin Morrow and Stephen Price for doing most of the development work for this new tool, and to the entire Tatari SRE team for their assitance, coverage, and proof reading!